


The inspiration for your next visual content project is probably hiding right under your nose. Here are six easy ways to find your next standout piece.
Get Started for FREE
Sign up with Facebook Sign up with X
I don't have a Facebook or a X account


 Your new post is loading...
 Your new post is loading...
Your new post is loading...
The inspiration for your next visual content project is probably hiding right under your nose. Here are six easy ways to find your next standout piece. 
No comment yet.
Sign up to comment

The quick reference guide to big data and data analytics; from the definition to the history and future applications of big data. Via Lauren Moss

Aurélia-Claire Jaeger's curator insight,
January 31, 2013 3:03 AM
Superbe infographie pour un résumé en image !
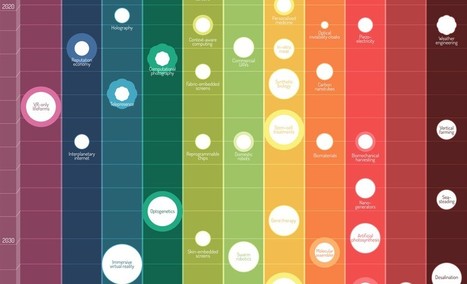
2012 might be the year which we reached 'peak infographic'. You can’t have an issue or a piece of data without putting it into a picture so it’s easier for people to understand. While this has mostly resulted in a glut of ugly graphics that don’t actually do anything with data (and you’ll see some of these below), it’s still an incredibly simple way to get information to you fast. And this year, some of our most compelling content has appeared in the format. These are some of our favorites. Via Lauren Moss

Lauren Moss's curator insight,
December 21, 2012 5:40 PM
A curated infographic gallery from FastCompany...
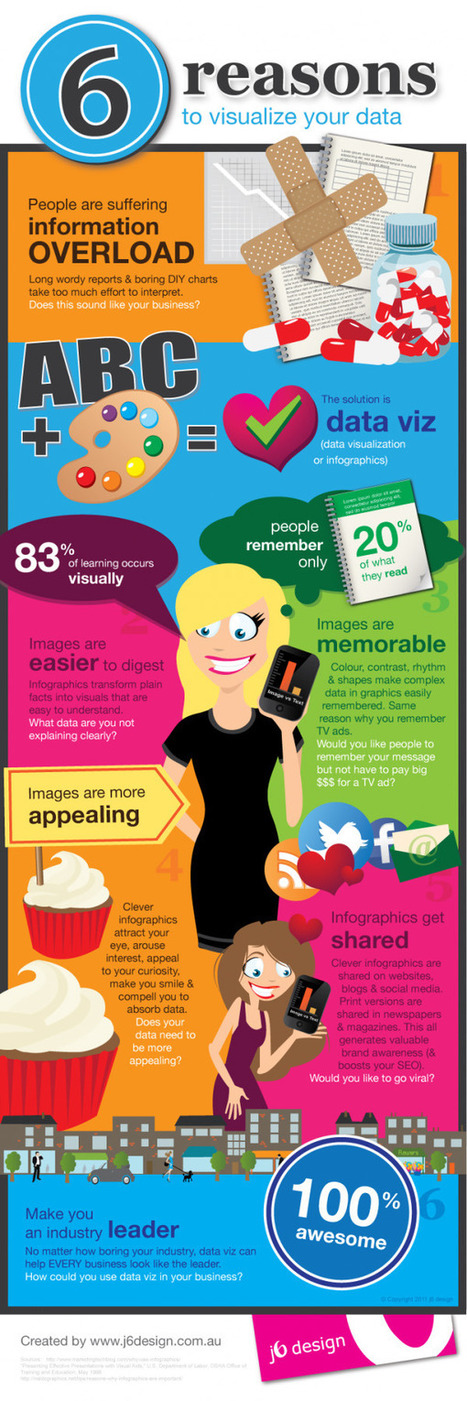
This piece was posted by Loren Sorenson for Hubspot, I selected it because as she says "If you aren’t prepared for the visual content revolution, you may be left in the dust. Not convinced? Let's take a look at exactly how visual contentis positively contributing to marketing strategies -- it may just give you the push you need "Learn why visual content is a critical part of your content creation strategy. Here are some highlights: **People remember only 20% of what they read **83% of learning is visual Condenses and Explains Large Amounts of Information **Today, there is too much information on the Internet you have about 3 seconds to catch someone’s eyes so they'll consume your information. Gives Your Brand an Identity **Visual content draws people in, letting viewers better understand your brand's identity Drives User Engagement **If you've ever read a book with a child, you probably know they find pictures more interesting than words; but are adults really that different? Selected by Jan Gordon covering "Content Curation, Social Business and Beyond" Read full article here: [http://bit.ly/Ifujbp] Via janlgordon

janlgordon's comment,
April 11, 2012 3:21 PM
Beth Kanter
Thank you for adding me to the wiki and for your kind words, it's greatly appreciated. Yes this is the conversation of the moment so to speak. I'm sure your presentation was amazing. Would love to hear it if you have a replay. 
Beth Kanter's comment,
April 11, 2012 10:08 PM
Jan: There's a link in the wiki to the live stream of the session - and a lot of notes and resources ... I love this topic! I'm holding myself back from created another scoop.it on it ...
janlgordon's comment,
April 13, 2012 10:05 PM
Beth Kanter
Thanks for looking forward to seeing this info. Knowing you, I can imagine that you want to start another scoopit on this topic but it's not necessary because you're already doing a wonderful job covering it now. |
![13 Reasons Your Brain Craves Infographics [Infographic] | Visualization Techniques and Practice | Scoop.it](https://img.scoop.it/drRLnCgu2GGUjqDC_MCtSzl72eJkfbmt4t8yenImKBVvK0kTmF0xjctABnaLJIm9)
This is downright spooky. It's an interactive infographic all about why your brain craves infographics. Food for thought! Via Gust MEES

ghbrett's curator insight,
July 23, 2013 8:49 AM
As the old saying goes: "A picture is worth a thousand words." This also reminds me of Malcomb Gladwell's book, "Blink." Amazon: http://amzn.to/13AalVQ 
Bruce McDuffee's curator insight,
August 20, 2013 2:53 PM
It's important to keep in mind your audience and how the ideal prospect likes to consume content. Scientists or engineers for example my consume or respect different media than consumers of clothing or electronics.
A pictorial display of statistics, the infographic is a huge hit in the internet age. But as one on rape figures has recently shown, they can be highly misleading. A picture apocryphally speaks a thousand words, but its 21st-century counterpart – the infographic – often says much less. It's no surprise that the grabby and easily shared format has taken off in the internet era, and the latest graphic to go viral is one on a tough and complex problem: rape and criminal justice... Via Lauren Moss
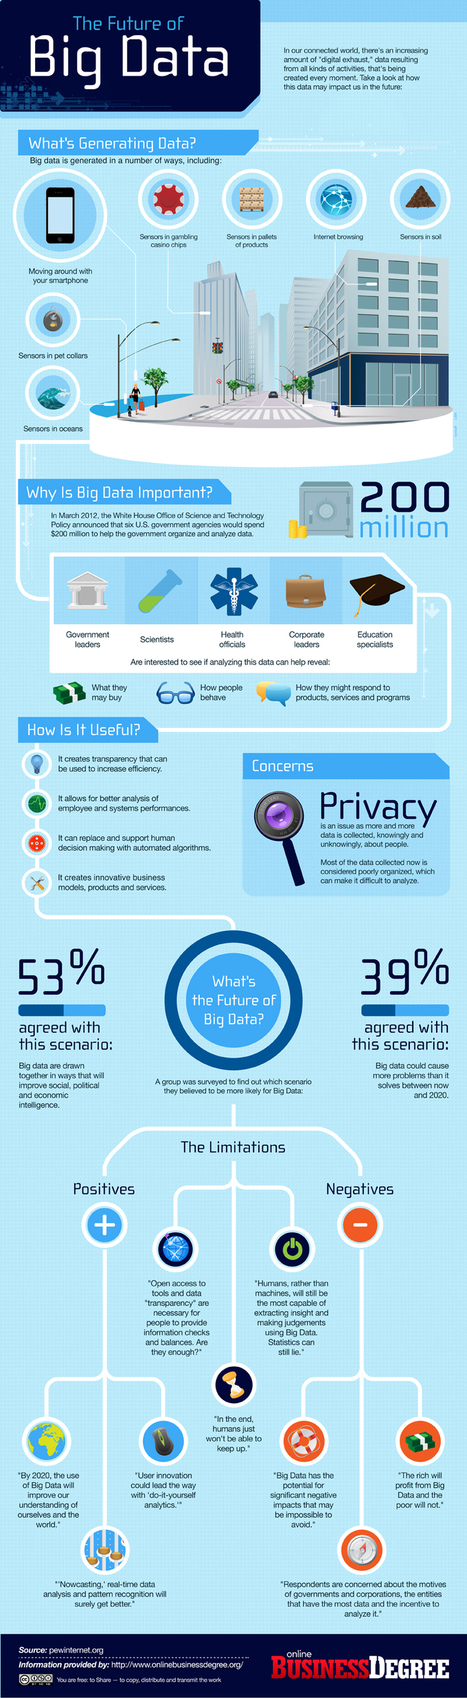
Big data is not new. It has existed for ages and can be attributed even to the initial years of computing. However, one might do well to consider why is there an increased buzz around this now. The answer is quite simple: Significant advances that have been brought about by x86 hardware have actually helped in bringing computing power to the masses. However, with new technologies, cloud computing has extended this power. Now, users have extended perimeters, while still being able to control costs effectively... Via Lauren Moss
Visual Skills to the ticket out of being overwhelmed
-------------- This piece was posted by Loren Sorenson for Hubspot, I selected it because as she says "If you aren’t prepared for the visual content revolution, you may be left in the dust.
Not convinced? Let's take a look at exactly how visual contentis positively contributing to marketing strategies -- it may just give you the push you need
"Learn why visual content is a critical part of your content creation strategy.
Here are some highlights:
**People remember only 20% of what they read
**83% of learning is visual
Condenses and Explains Large Amounts of Information
**Today, there is too much information on the Internet you have about 3 seconds to catch someone’s eyes so they'll consume your information.
Gives Your Brand an Identity
**Visual content draws people in, letting viewers better understand your brand's identity
Drives User Engagement
**If you've ever read a book with a child, you probably know they find pictures more interesting than words; but are adults really that different?
Selected by Jan Gordon covering "Content Curation, Social Business and Beyond"
Read full article here: [http://bit.ly/Ifujbp] Via janlgordon
janlgordon's comment,
April 11, 2012 3:21 PM
Beth Kanter
Thank you for adding me to the wiki and for your kind words, it's greatly appreciated. Yes this is the conversation of the moment so to speak. I'm sure your presentation was amazing. Would love to hear it if you have a replay.
Beth Kanter's comment,
April 11, 2012 10:08 PM
Jan: There's a link in the wiki to the live stream of the session - and a lot of notes and resources ... I love this topic! I'm holding myself back from created another scoop.it on it ...
janlgordon's comment,
April 13, 2012 10:05 PM
Beth Kanter
Thanks for looking forward to seeing this info. Knowing you, I can imagine that you want to start another scoopit on this topic but it's not necessary because you're already doing a wonderful job covering it now. |


The good news is, the inspiration for your next visual project is probably hiding right under your nose. Where to find data:
1. Your Company's Data
2. Survey you conductor or sponsor
3. From a partner
4. Government Data
5. Social Media streams
6. Older Content